Skip to content

Market studies

Your area’s market, explained.

Choose the area you want to analyse and instantly get prices, supply and market trends. Five types of study, ready to send with your branding.

3 days free · No credit card · No commitment

Market study in Betterplace: price reductions and price trends in the area (sample data)
Study area64 ha
  • Sale
  • Rental
  • Population
  • Commercial
  • Economic
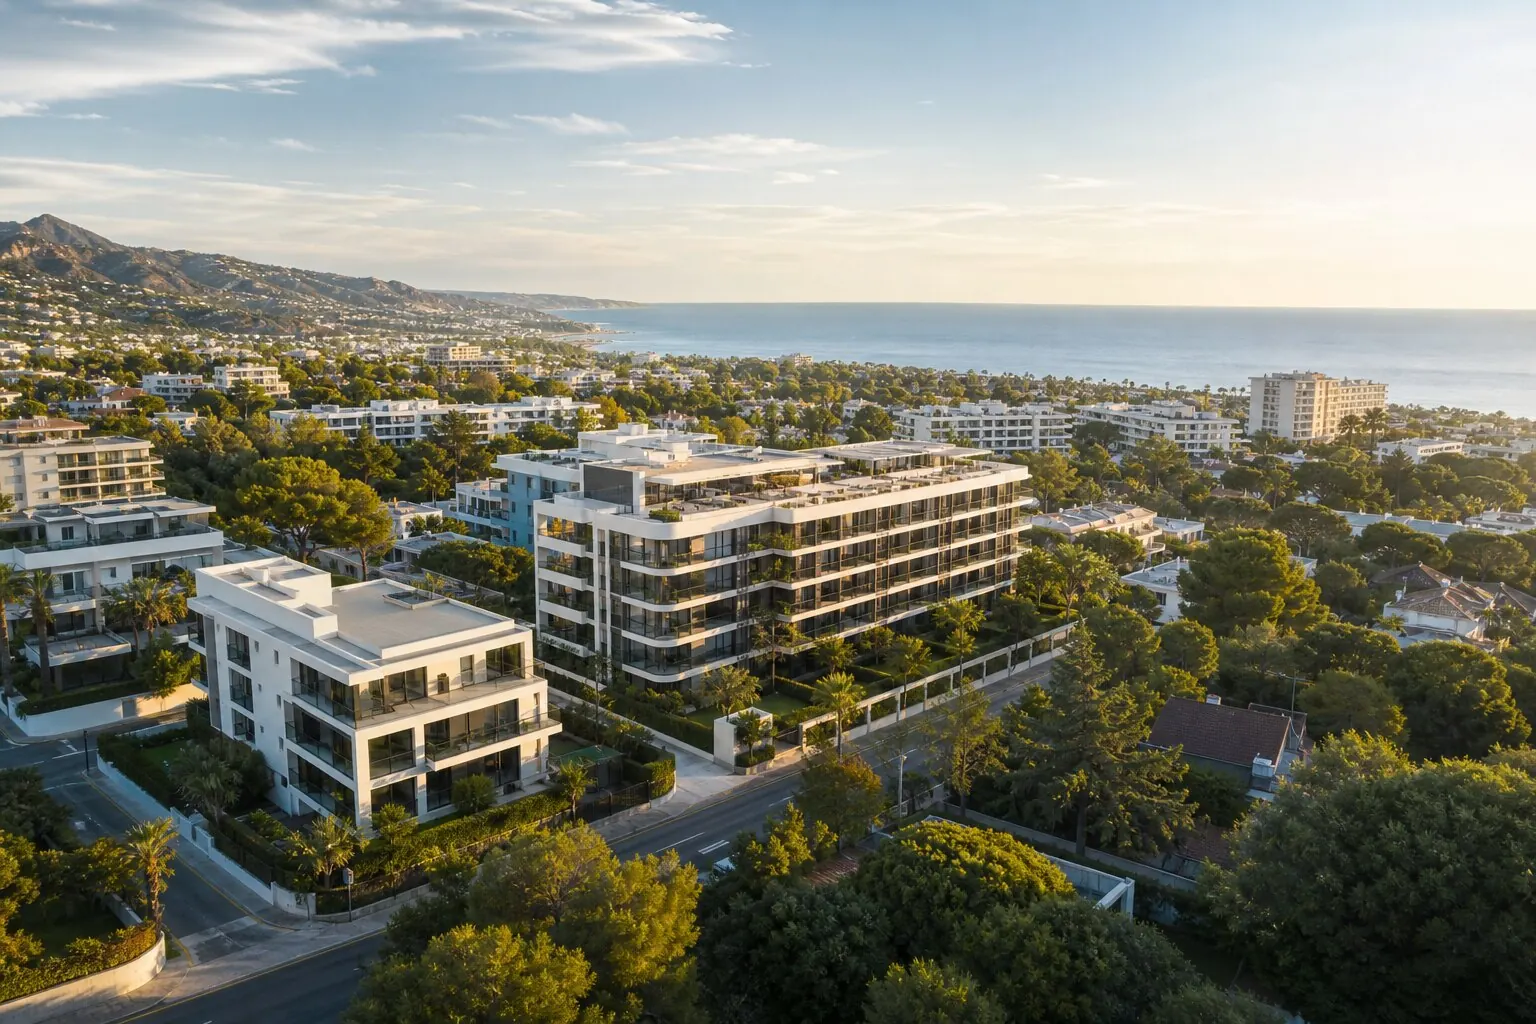
Aerial view of a residential neighbourhood with the study area drawn on it
Study areaArea analysed64 ha

01 · The area

Start with the map.

The exact area you work, not the one a portal decides for you.

  • Draw on the mapDraw a custom area by hand, directly on the map.
  • Province or municipalitySelect the area by province or by municipality.
  • Use a saved areaReuse one of your saved prospecting areas.

02 · The study type

Five studies for the same area.

Switch tabs and see what each one tells you.

Sale01 / 05

Home prices, supply and trends

Includes

  • Supply overview and typical home
  • Price trends compared with the municipality
  • Time on market and supply by size
  • Cadastre data: age, build quality and renovations

Source: Publicly accessible property portals and the Cadastre

Sample data

2,587€/m²

Average price

4,521

Homes on the market

26.96%

Price reduced

Price trends

Monthly average in €/m²

Study areaMunicipality
JunSepDecMarJun

For your clients

The four questions they always ask you.

Each one has its own chart in the study.

1Answered by: Price trends

How are prices changing?

The area’s €/m² month by month, against the municipal average.
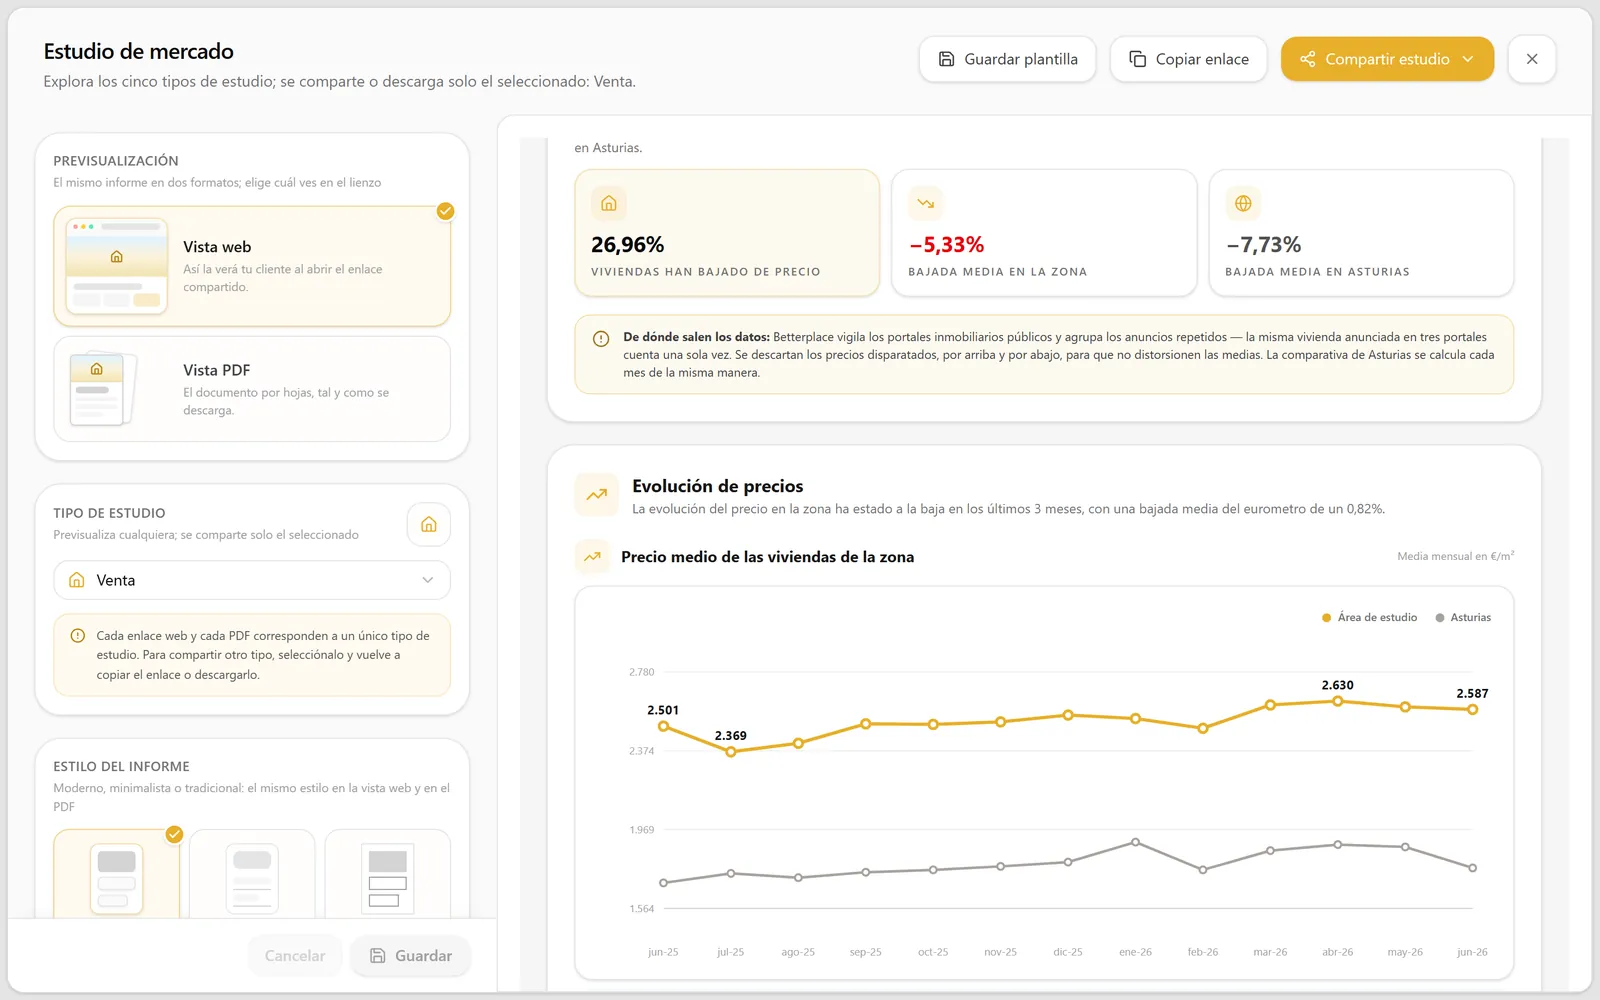
Market study in Betterplace: price reductions and price trends in the area (sample data)
2Answered by: Supply overview

How much competition is there?

How many homes are on the market and what the typical home looks like.
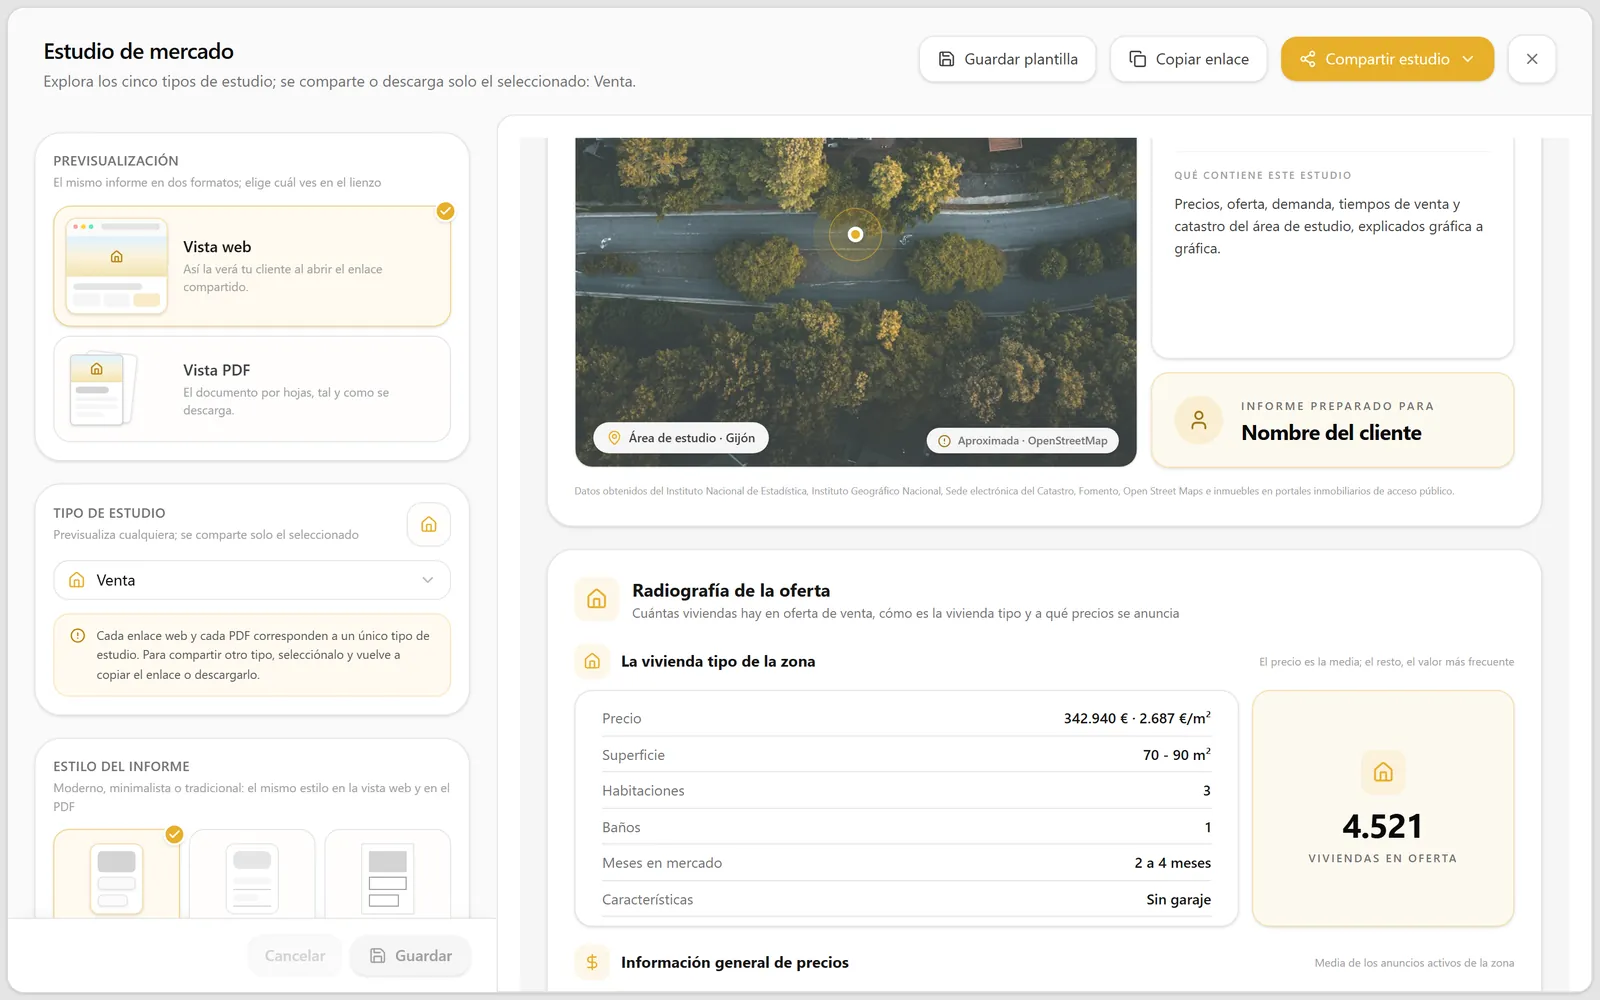
Supply overview in a Betterplace study: the typical home and the homes on the market (sample data)
3Answered by: Supply and demand

What are buyers looking for?

Which size bands concentrate demand compared with supply.

SupplyDemand
<6060–8080–100100–120120–150>150

m²

4Answered by: Time on market

How long does it take to sell?

How long homes have been listed, since the listing was first detected.

  • Under 1 month18%
  • 1 to 3 months34%
  • 3 to 6 months24%
  • 6 to 12 months15%
  • Over 12 months9%

Typical home: 2 to 4 months on the market

Sample data

Inside a sale or rental study

The area, chapter by chapter.

Self-explanatory charts, with the municipal average as a benchmark.

  1. 4,521

    homes on the market

    Chapter 01

    Supply overview

    Homes on the market, typical home and price reductions.

  2. Chapter 02

    Price trends

    The area’s average €/m², month by month.

  3. Chapter 03

    Time on market

    Since the listing was first detected.

  4. Chapter 04

    Supply and demand

    How they break down by size band.

  5. Chapter 05

    Asking prices

    By price band and by €/m² band.

  6. Chapter 06

    Price and size

    The full cross-analysis of price and floor area.

  7. 1
    2
    3
    4+

    Chapter 07

    Features

    Bedrooms, bathrooms and parking.

  8. 5.1%

    Chapter 08

    Average yield

    How much of the price is recouped each year by letting.

Comparison with the municipality

The grey line is the municipal average, calculated the same way every month.

Study area
2,587 €/m²
Municipality
1,790 €/m²
Study areaMunicipality

Configure the report

  • Extended report
  • Cadastre data
  • Map on the cover
  • Back cover
  • Company information

The extended report adds the breakdown of supply by price, €/m², size, bedrooms, bathrooms and parking.

Sample data

Cadastre data

Here the source changes.

This data doesn’t come from listings but from the official Cadastre register. It counts every home in the area, whether it’s for sale or not.

  • Homes on the market out of the total housing stock
  • Breakdown by age
  • Build quality, from 1 (very high) to 9 (very low)
  • Renovated homes and type of renovation

In sale and rental studies of areas in Spain.

Cadastre data

Sample data

7 out of 100

Homes on the market out of the total stock

Out of every 100 homes in the area, how many are on the market

Breakdown by age

<1960607080900010+

Build quality

1 · very high9 · very low

Renovated homes

  • Study area12%
  • Municipality9%

03 · The report

Your branding, as a web page or PDF.

Every study downloads as a report ready to share with your client. Your agent card is included: WhatsApp, phone and a QR code to your website.
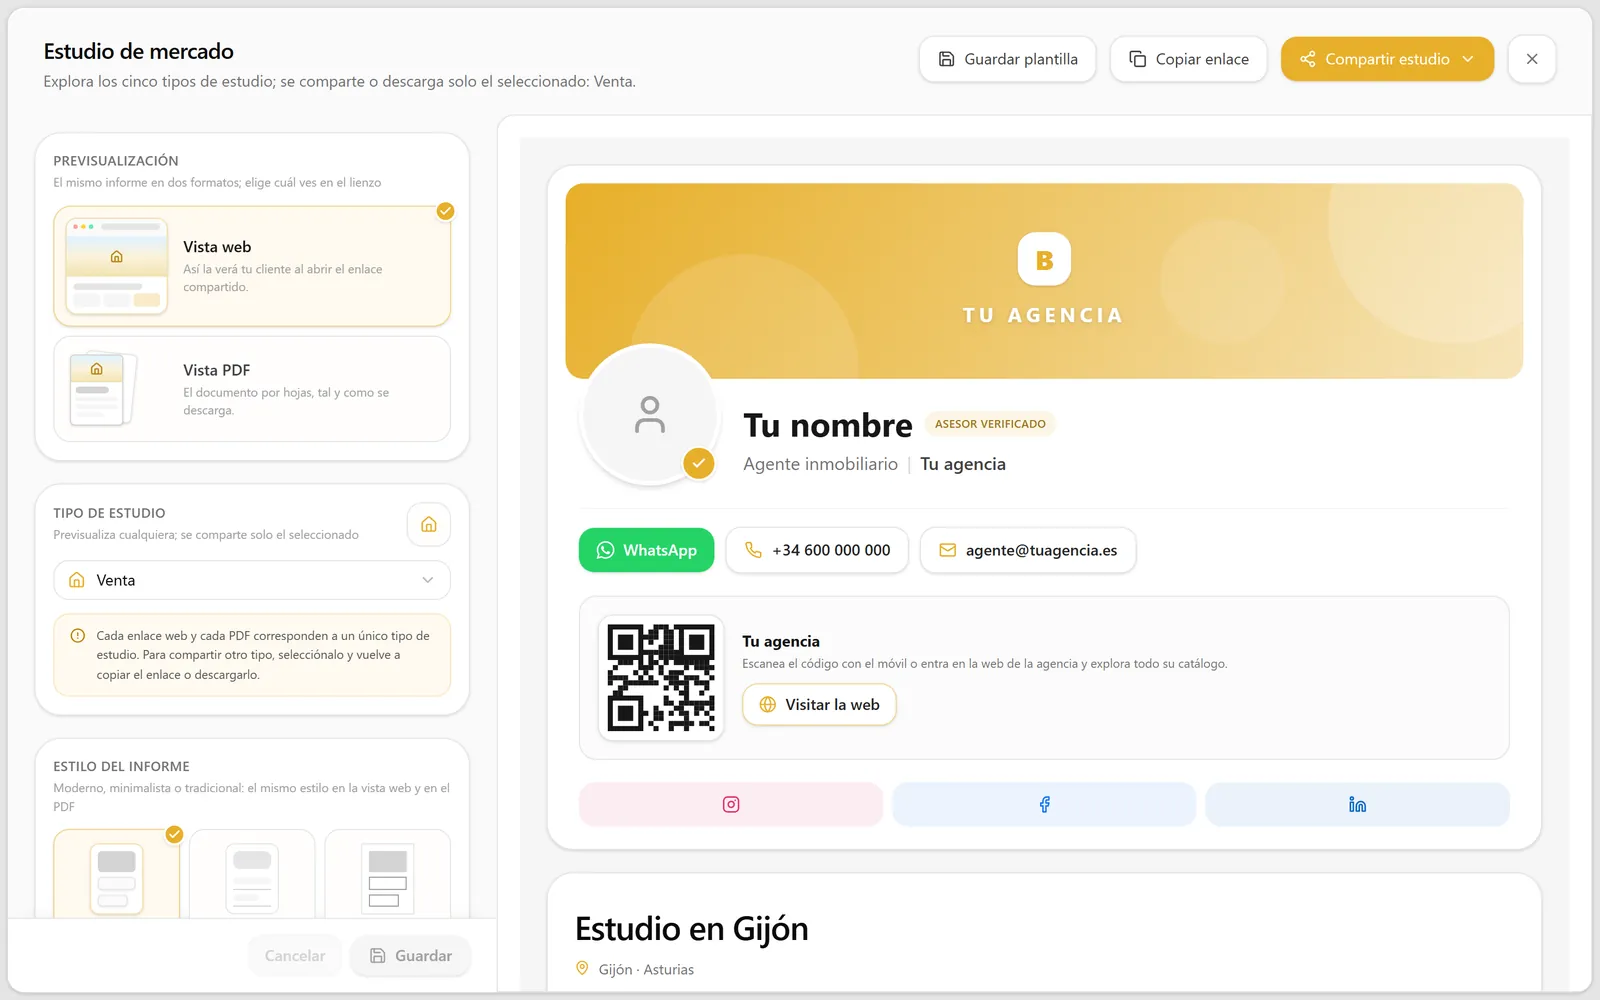
  • Modern, Minimalist or Traditional style
  • Seven report languages
  • Send by WhatsApp, email or link
  • Save your settings as a template
Betterplace market study editor with the agent card, web view and PDF view (sample data)

One report, two formats

You choose which one you see on screen; your client chooses how to open it.
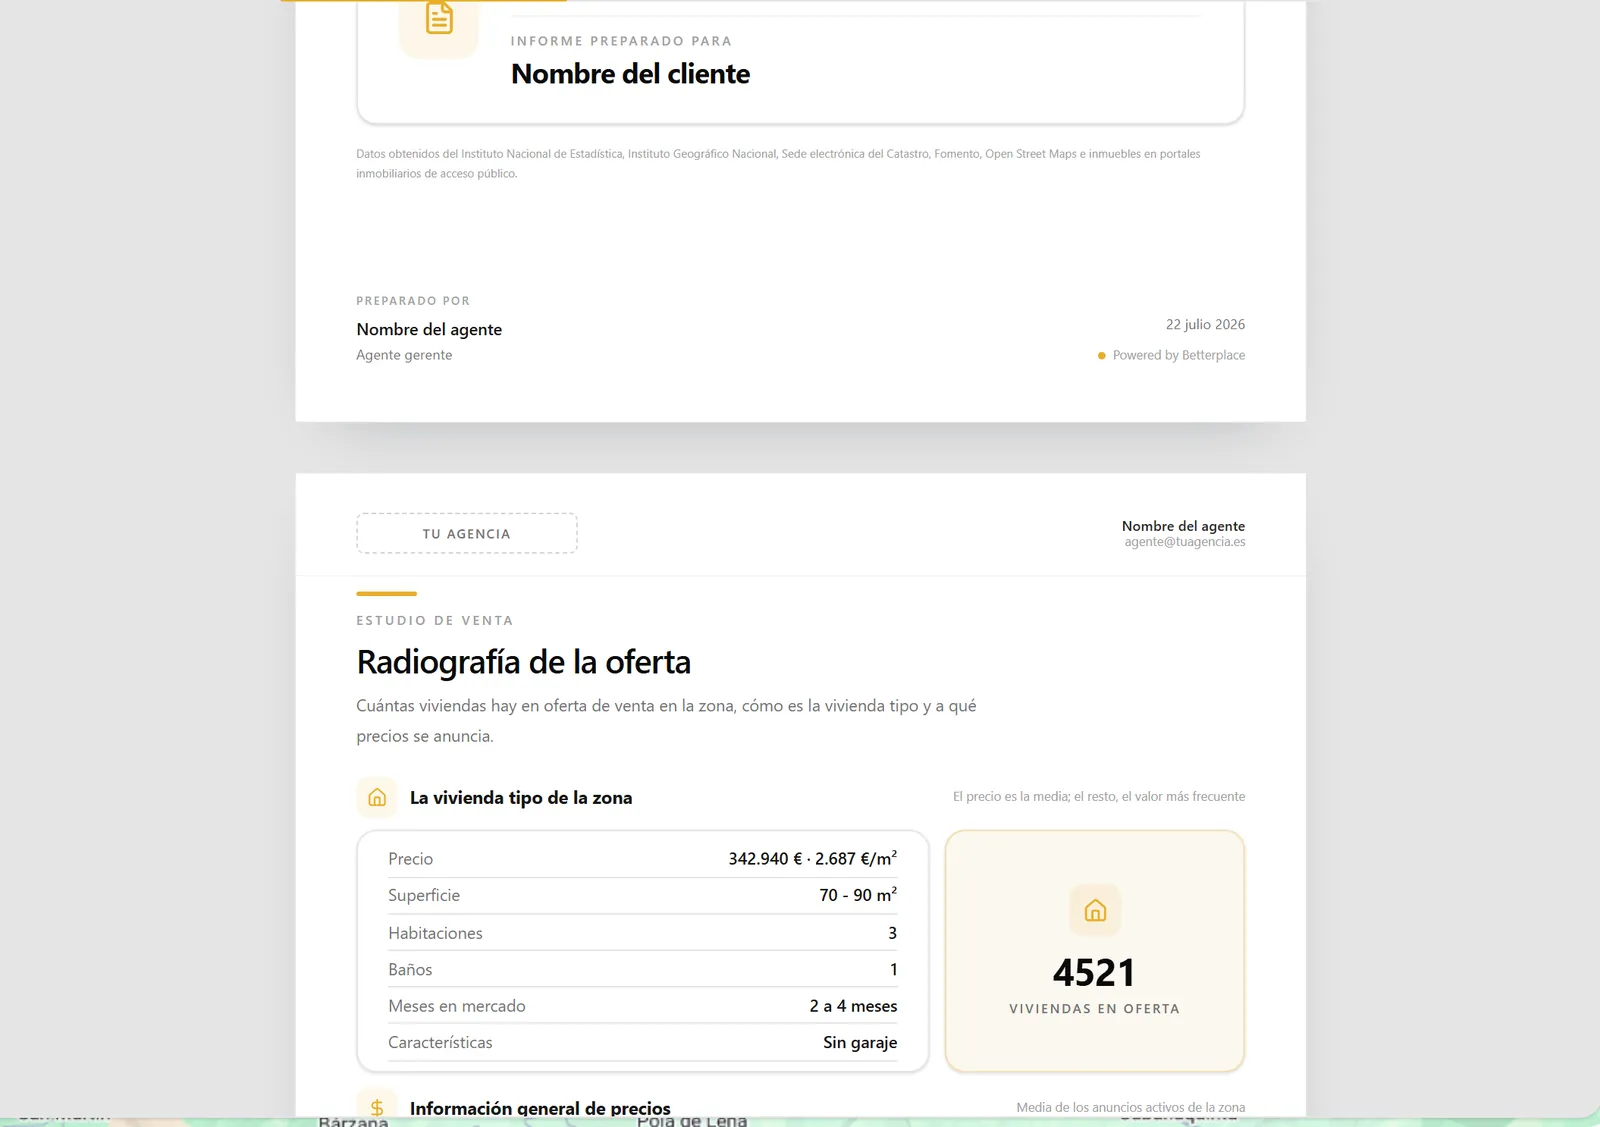
Web viewPDF view
“Supply overview” page of a sale study report (sample data)

My market studies

All your studies in one place: search, share or download them.
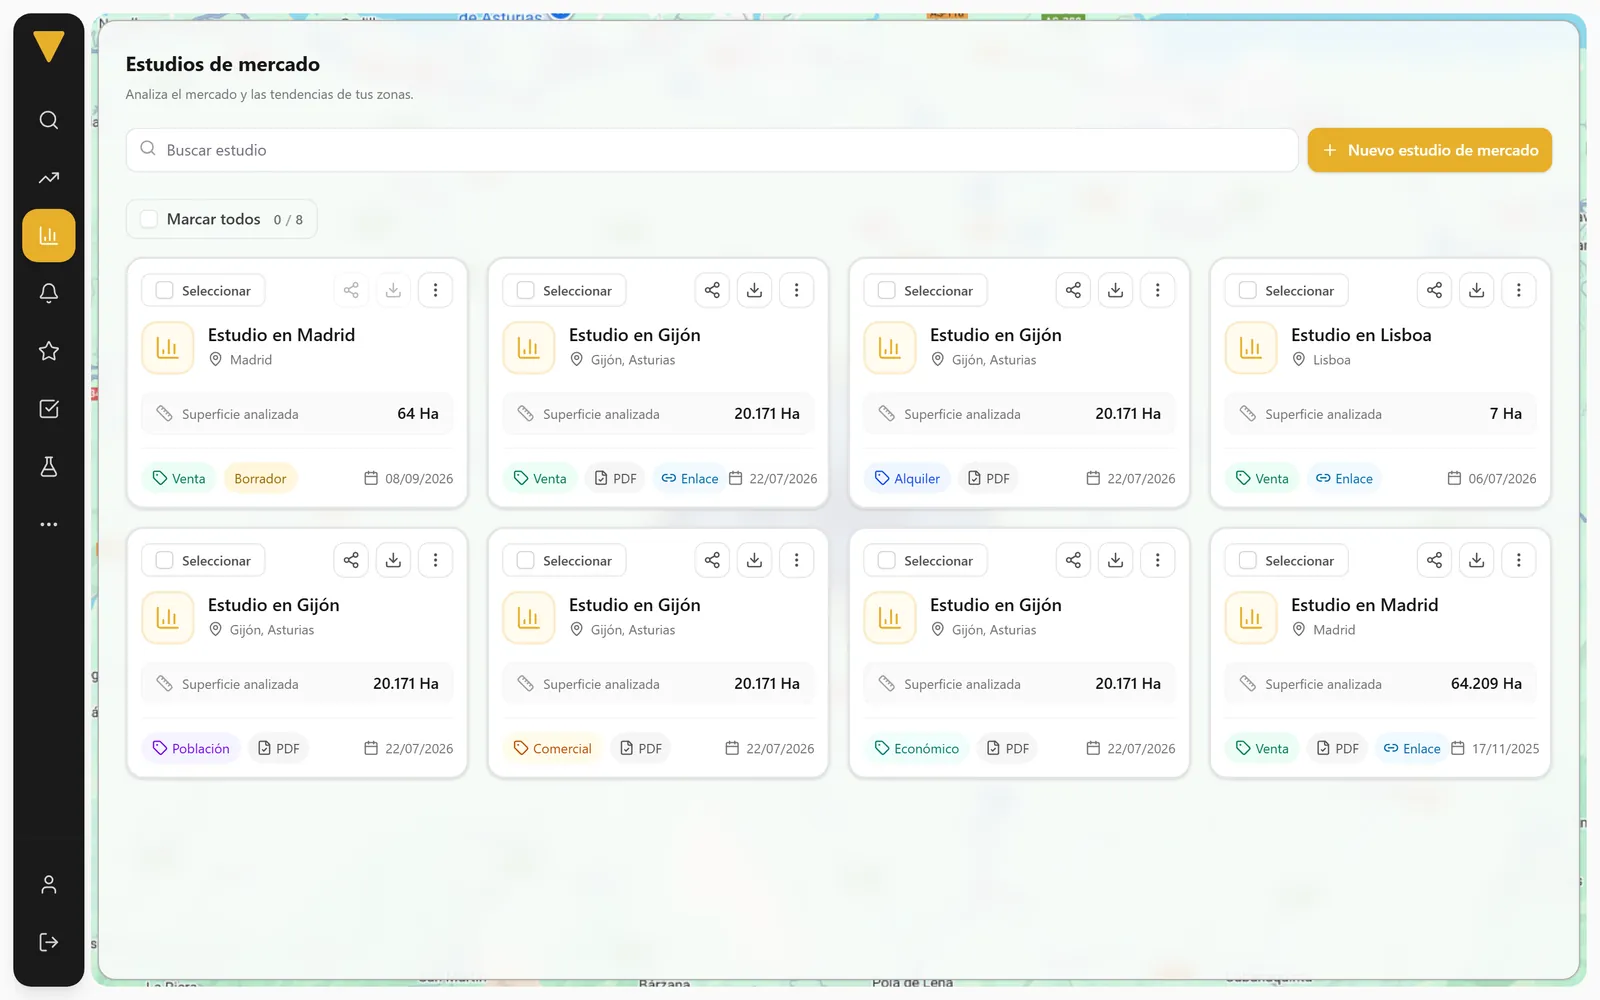
SaleRentalPopulationCommercialEconomic
“Market studies” list in Betterplace with sale, rental, population, commercial and economic studies (sample data)
  • 5study types
  • 3report styles
  • 18covers to choose from
  • 7report languages

How agencies use it

At Century 21 Aguere they run a market study almost every day to track how their area is evolving, and it is something investors really notice.

Javier DobladoBroker · Century 21 Aguere · 2021Read the interview (in Spanish)

×2 new listings a month: from 11–14 to 20–25

Where the data comes from

Every chart, with its source.

Public and official sources, cited in the report itself.

  • Property portalsPublicly accessible: supply, prices and time on market. The same home on three portals counts once.
  • CadastreHousing stock, age, build quality and renovations.
  • INEPopulation by age and gender, and foreign population.
  • IGN and OpenStreetMapThe area’s surroundings and points of interest.

Your study

Grouped, no duplicates

Five study types

  • 01Sale
  • 02Rental
  • 03Population
  • 04Commercial
  • 05Economic

Outlier prices, both high and low, are discarded so they don’t distort the averages. The comparison with the municipality is calculated every month.

Frequently asked questions

Good to know

Limits included: better to know them before your first client meeting.

Talk to us
Which areas can I analyse?
You can draw the area on the map, choose a province or a municipality, or reuse one of your saved prospecting areas. Access depends on the provinces included in your plan.
Is there a maximum area size?
Yes. To download a study, the area can’t exceed a maximum size in hectares, or a maximum radius if you draw a circle. If your area is larger, try by census tract or draw a smaller area. Some study types aren’t available in every area.
Can I download studies from my phone?
To download market studies, sign in from your computer. The web view of the report does open on your client’s phone.
How often is the data updated?
Betterplace monitors publicly accessible property portals, and the comparison with the municipality is calculated every month. Population, Cadastre and surroundings data come from the INE, the Cadastre, the IGN and OpenStreetMap.
What does the extended report add?
The breakdown of homes on the market by price, €/m², size, number of bedrooms and bathrooms, and parking availability.
Can I customise the report?
Yes: Modern, Minimalist or Traditional style, map on the cover, back cover, Cadastre data, company information and your agent card. The report is available in seven languages and you can save your settings as a template.
How many studies does the free trial include?
The trial lasts 3 days, requires no credit card and includes 5 market study reports.

Walk into your next client meeting with the area’s data.

Create your first market study today: the trial includes 5 market study reports.

3 days free · No credit card · No commitment